0074: Nodes-n-noodles I – Doodle a Noodle
This post is the beginning of another new series and, for want of a better name, it shall be called… well… it’s right there in the title: Nodes-n-noodles.
But what are these nodes and noodles of which I speak?
This is a UI element that caught my imagination a few years ago when I first saw it in Blender’s Node Editor. Even if the term nodes-n-noodles isn’t familiar, the concept might be. It boils down to this:
- two or more UI elements (nodes) with connectors, and
- if you click on one element’s connector and drag to the other element’s connector,
- voilá, you’ve got a noodle connecting two nodes.
And in Blender, it looks like this:
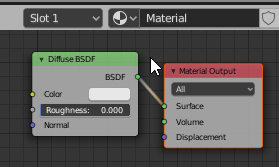
Blender opted for straight noodles, but we’re going a different way… Bezier curves.
This UI concept opens up a lot of possibilities. In fact, the Blender Foundation has decided to use this nodes-n-noodles approach wherever possible in Blender. It’s intuitive and easy to use. And in Cairo, it’s almost ridiculously simple to implement because all the heavy lifting goes on behind the scenes.
How This Miniseries Will Play Out
We’ll look at this in three phases…
First, we’ll start with simply drawing a noodle using a cubic Bezier curve, then work towards controlling the drawing of the curve with the mouse.
Second, we’ll dig into drawing a node with visible connectors. By the end of this second phase, we’ll have two nodes and be able to move them around within the DrawingArea’s Context.
Third, we’ll bring nodes and noodles together. We’ll be able to connect the nodes and work toward being able to move one node around while the noodle-curve connecting it to the other node updates to accommodate the new position of the node.
How to Doodle a Noodle: Step 1
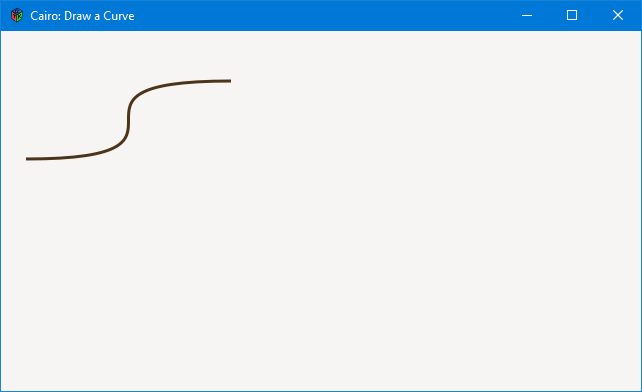
We’ve actually talked about the basics of this technique before in Blog Post #60. All we’re really doing is drawing a curve, but this time we’re taking a few more things into consideration…
Opposing Control Points
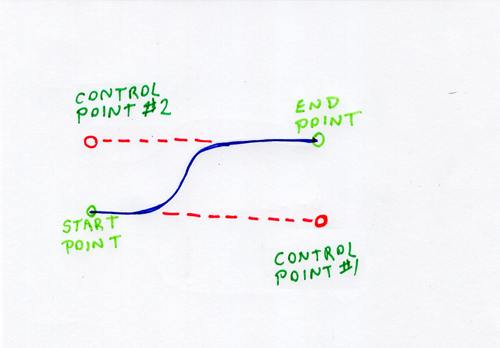
This type of cubic Bezier curve is easy to draw. Given that a Cairo curve is drawn using four sets of coordinates—start point, first control point, second control point, and the end point—we just need keep these things in mind:
The coordinates of the first control point break down like this:
- the x position is the same as the end point’s x, and
- the y position is the same as the start point’s y.
The second control point’s coordinates work out to be:
- x is the same as the start point’s x position, and
- y is the same as the end point’s y position.
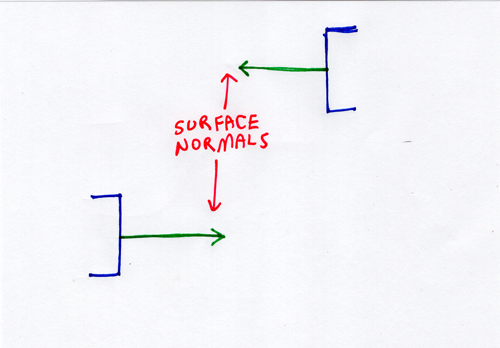
This, of course, requires that the control points describe surface normals for the two nodes being connected. In a nutshell (if you’re unfamiliar with the concept of a surface normal) it’s a perpendicular line radiating from a surface. In 2D graphics, it looks like this:
So, when we draw the cubic Bezier curve, we—in fact—only need the start and end coordinates and the coordinates for the control points can be extrapolated.
The DrawingArea Code
class MyDrawingArea : DrawingArea
{
	double xStart = 25,  yStart = 128;
	double xEnd = 230, yEnd = 50;

	this()
	{
		addOnDraw(&onDraw);

	} // this()


	bool onDraw(Scoped!Context context, Widget w)
	{
		double xControlPoint1 = xEnd, yControlPoint1 = yStart;
		double xControlPoint2 = xStart, yControlPoint2 = yEnd;
		// set up and draw a cubic Bezier
		context.setLineWidth(3);
		context.setSourceRgb(0.3, 0.2, 0.1);
		context.moveTo(xStart, yStart);
		context.curveTo(xControlPoint1, yControlPoint1, xControlPoint2, yControlPoint2, xEndPoint, yEndPoint);
		context.stroke();

		return(true);

	} // onDraw()

} // class MyDrawingArea
In the class preamble, we define the start and end points of the curve. Normally, this is where I’d also put the declarations and definitions for the control points as well, but because it’s illegal to assign one variable to another in the preamble, these variable assignments are done in the constructor.
And the rest is close enough to the third example (Drawing a Curve) in Blog Post #60 as to need no further explanation.
Conclusion
And that’s step one/phase one of drawing a noodle. Next time, we’ll carry on and look at the other steps we have to take in order to draw a ‘live’ noodle with the mouse.
Comments? Questions? Observations?
Did we miss a tidbit of information that would make this post even more informative? Let's talk about it in the comments.
- come on over to the D Language Forum and look for one of the gtkDcoding announcement posts,
- drop by the GtkD Forum,
- follow the link below to email me, or
- go to the gtkDcoding Facebook page.
You can also subscribe via RSS so you won't miss anything. Thank you very much for dropping by.
© Copyright 2025 Ron Tarrant
